 1 / 11
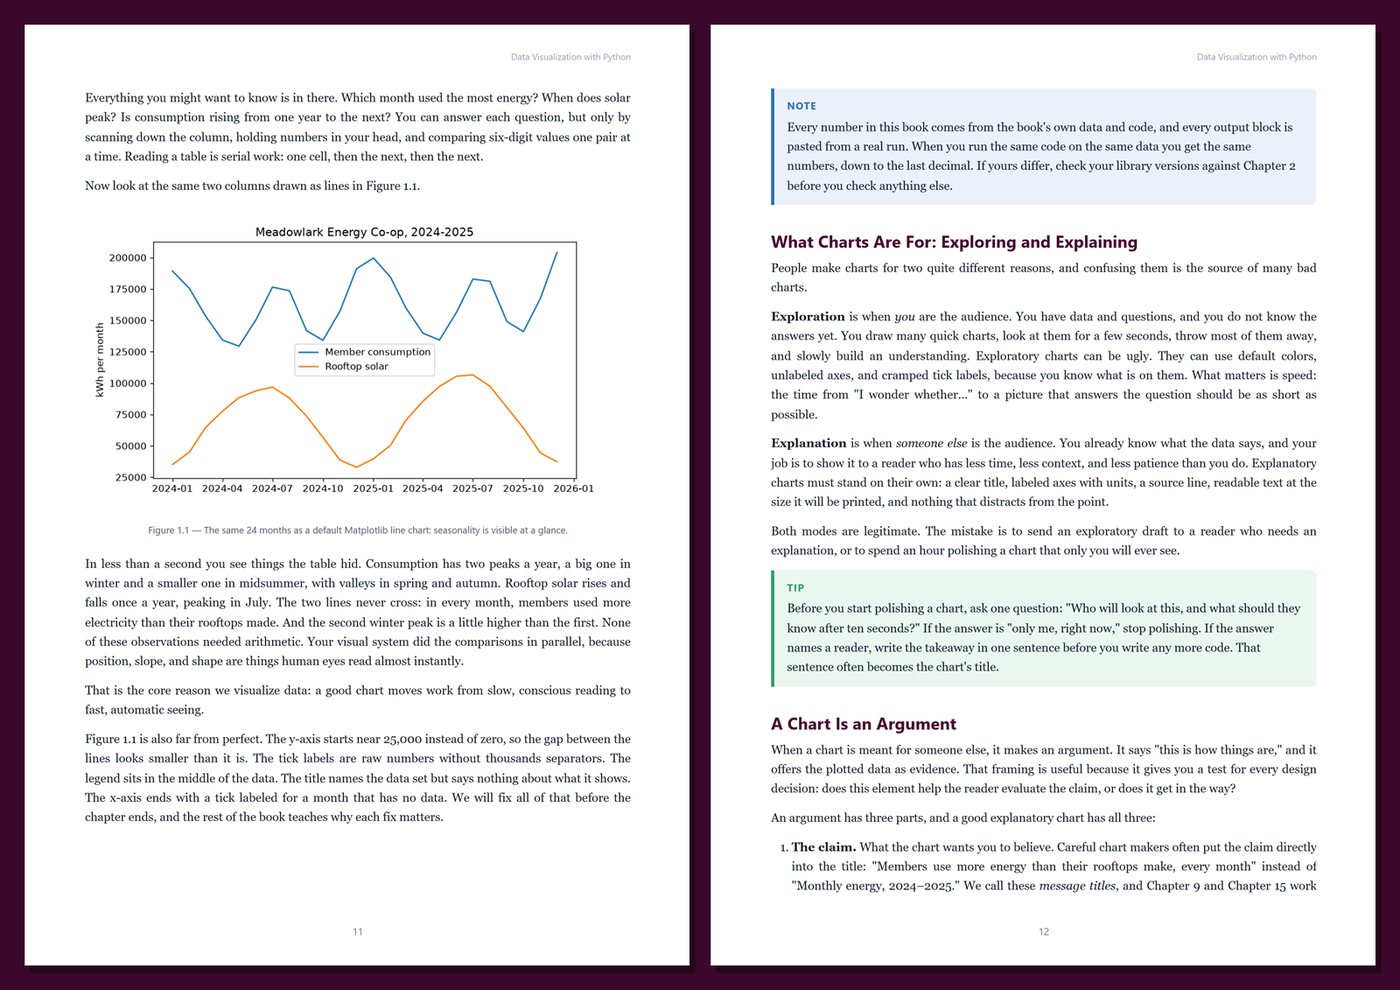
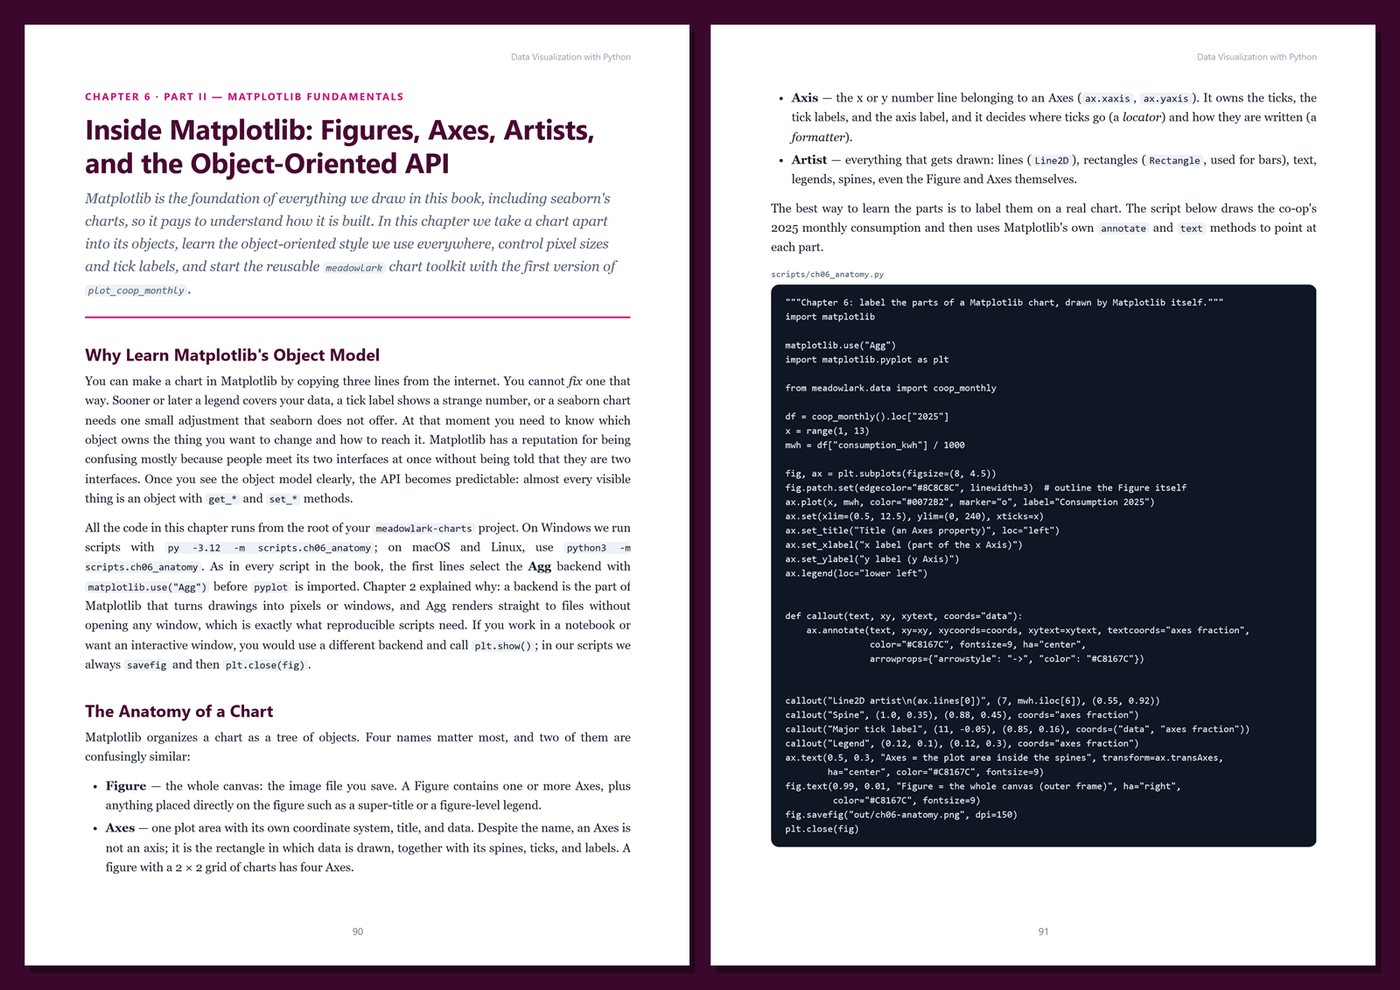
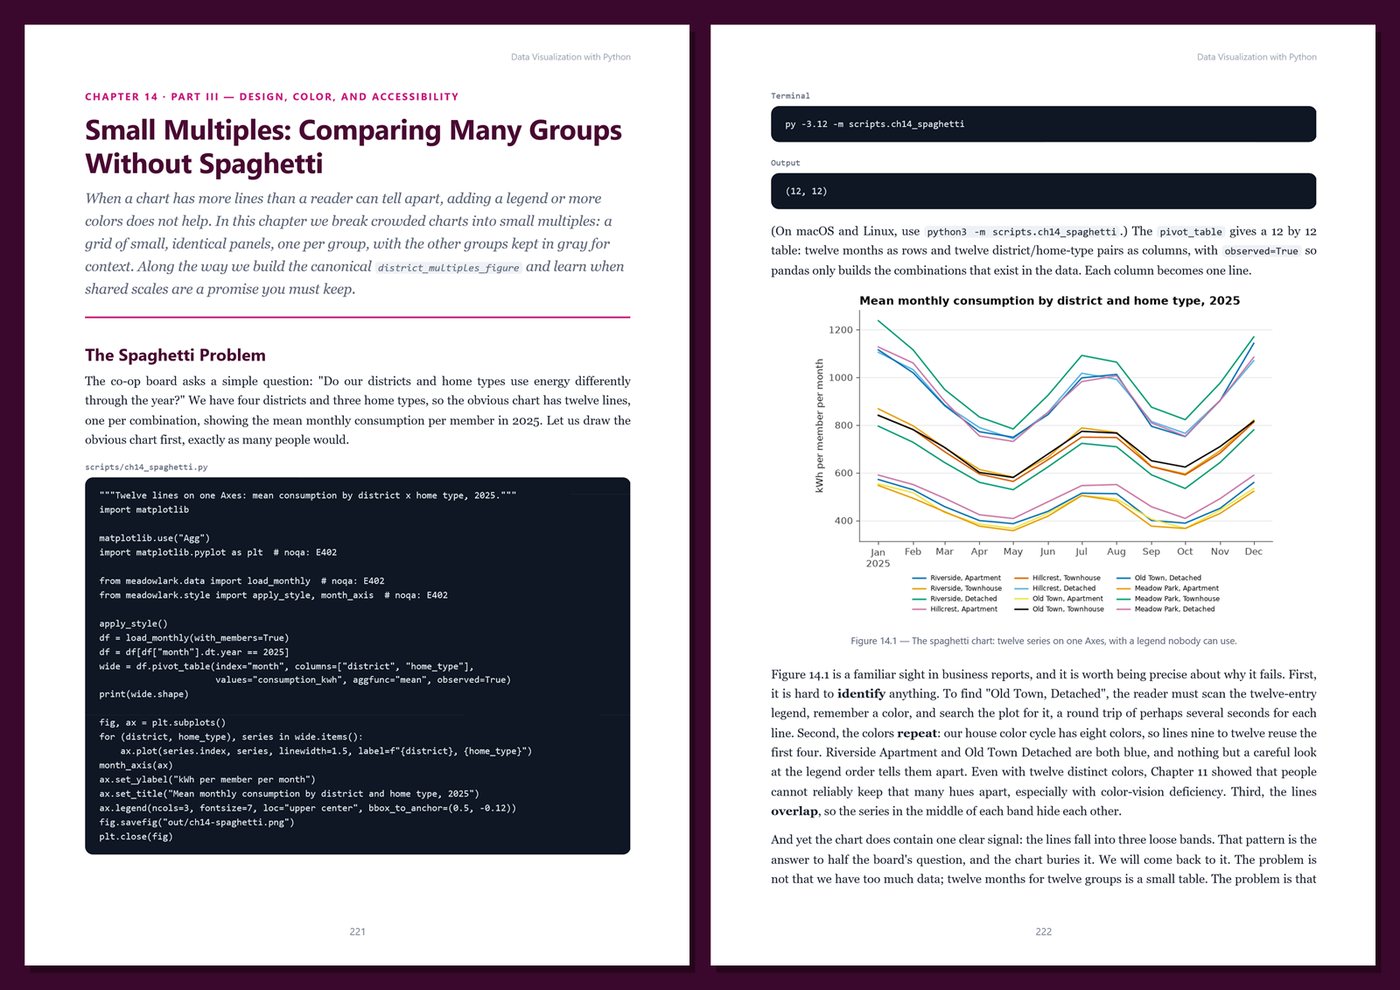
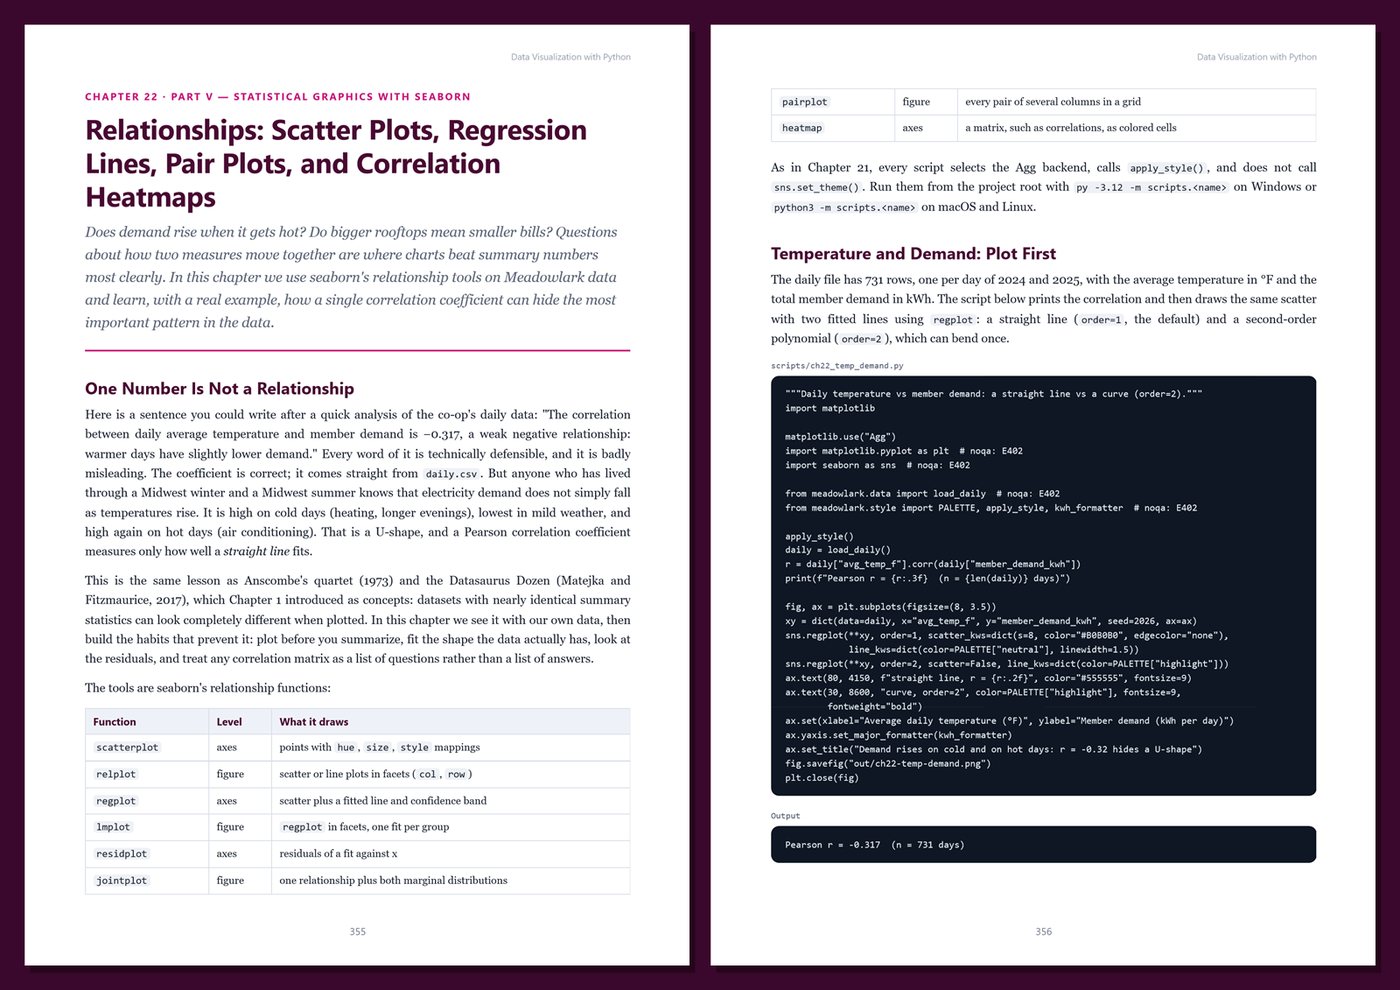
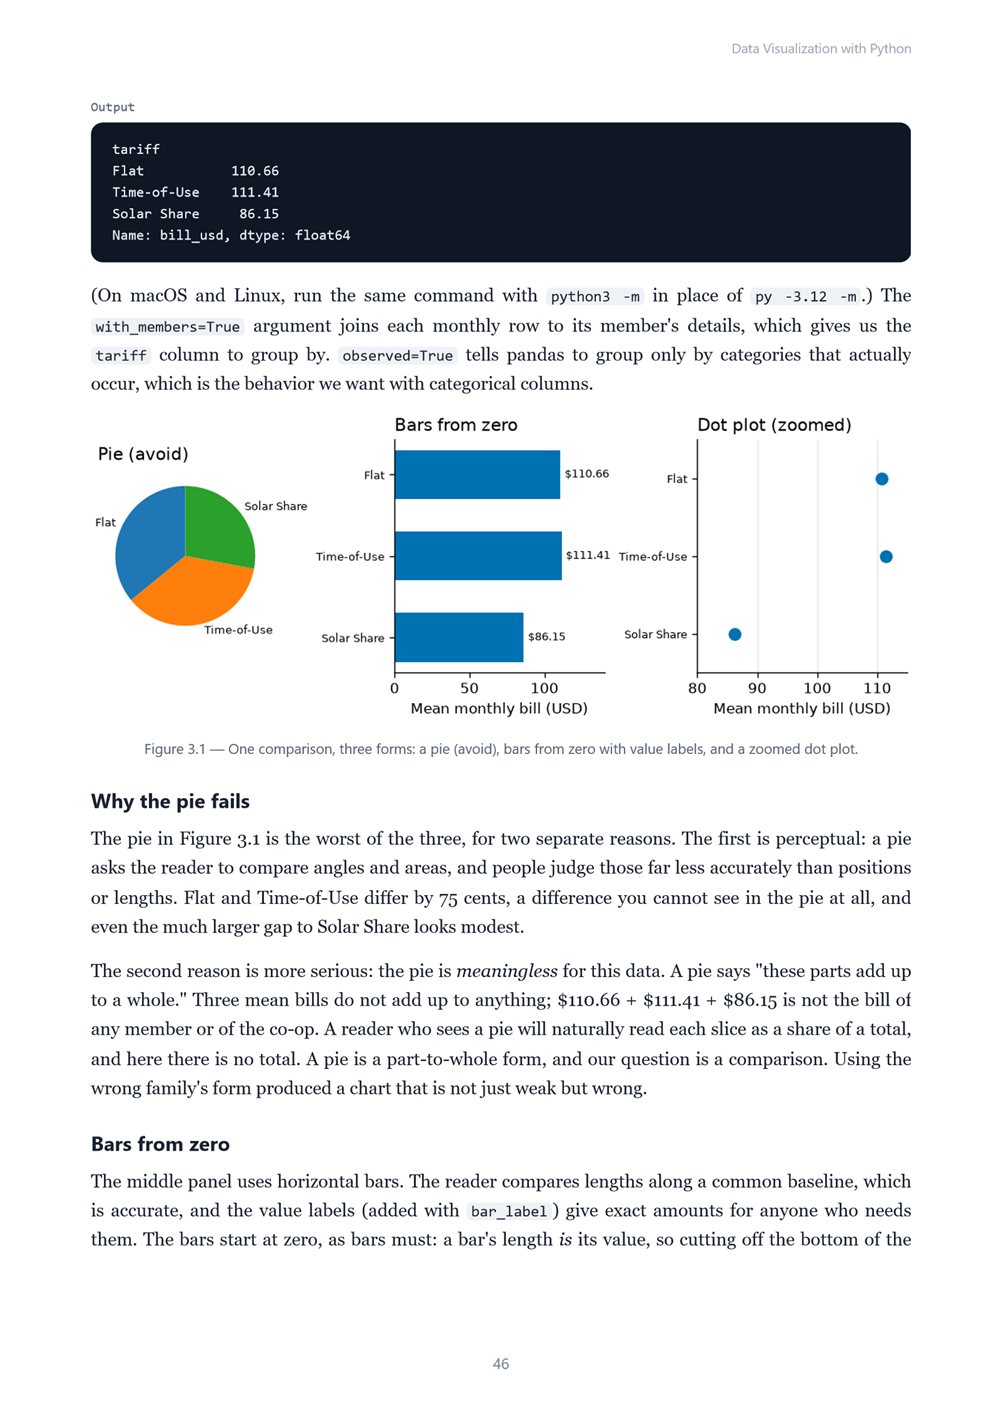
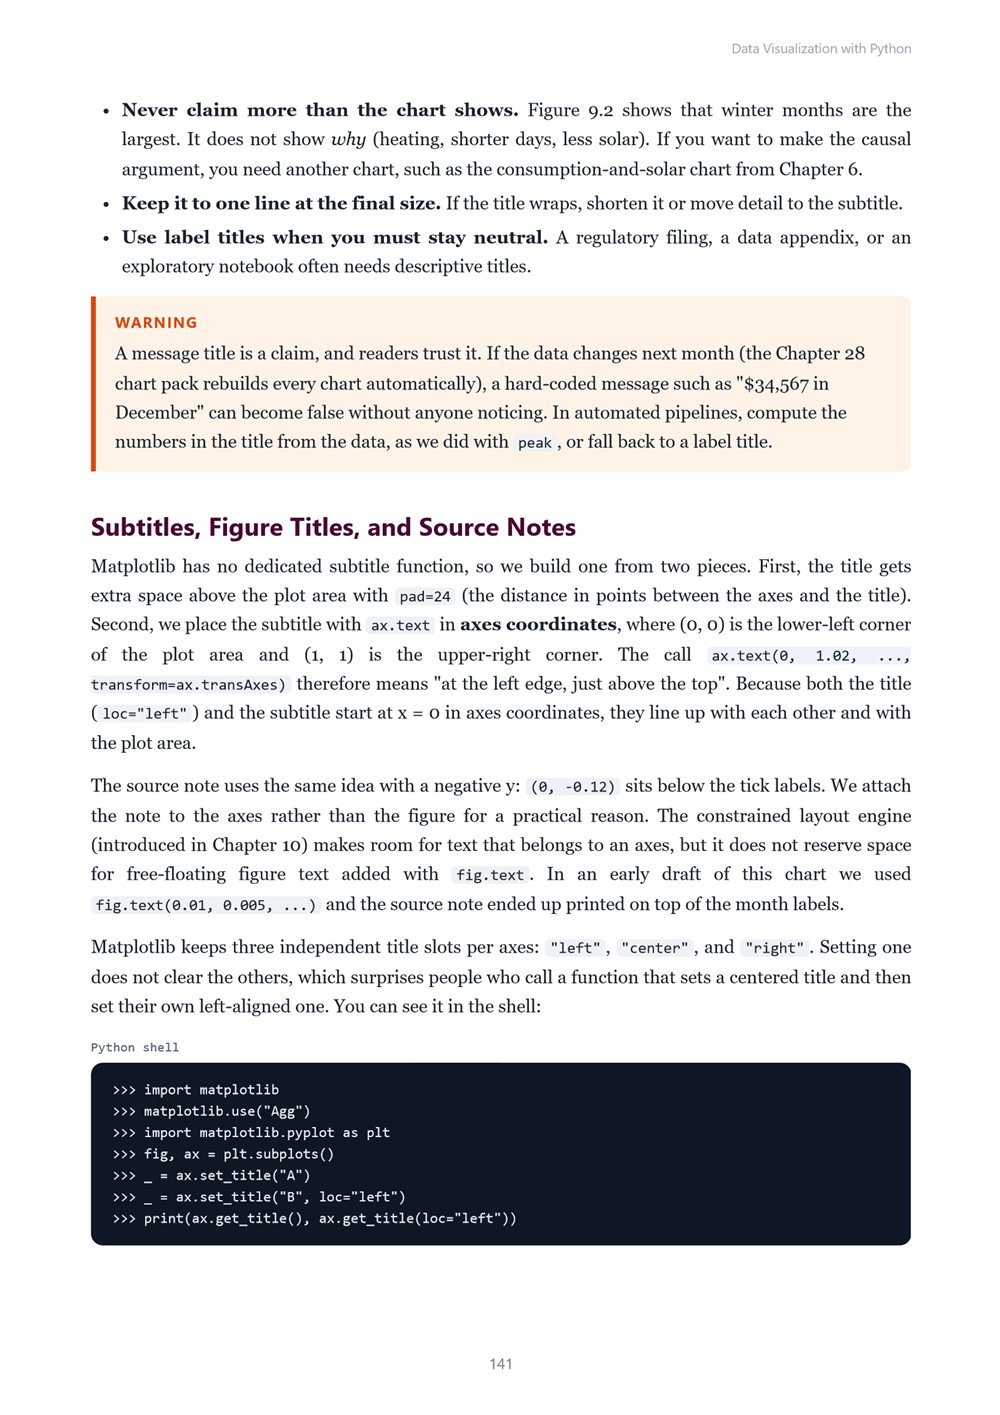
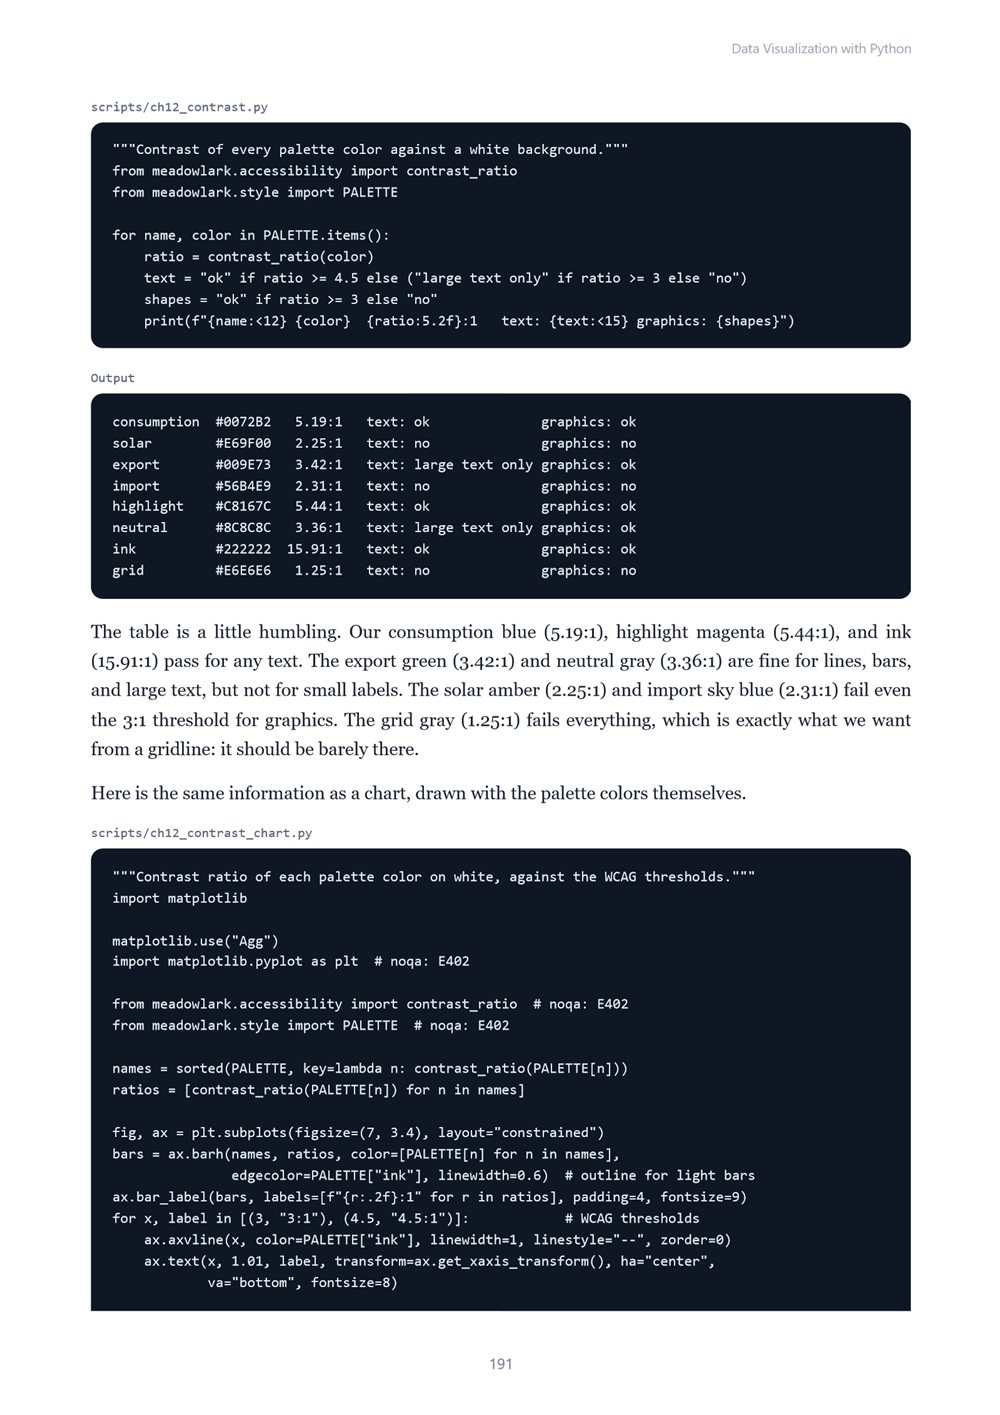
Learn to make charts that are clear, honest, accessible, and reproducible with Python: choosing the right chart, how people perceive charts, honest baselines and scales, Matplotlib from the inside, color and accessibility, house styles, small multiples, storytelling, time series, heatmaps…
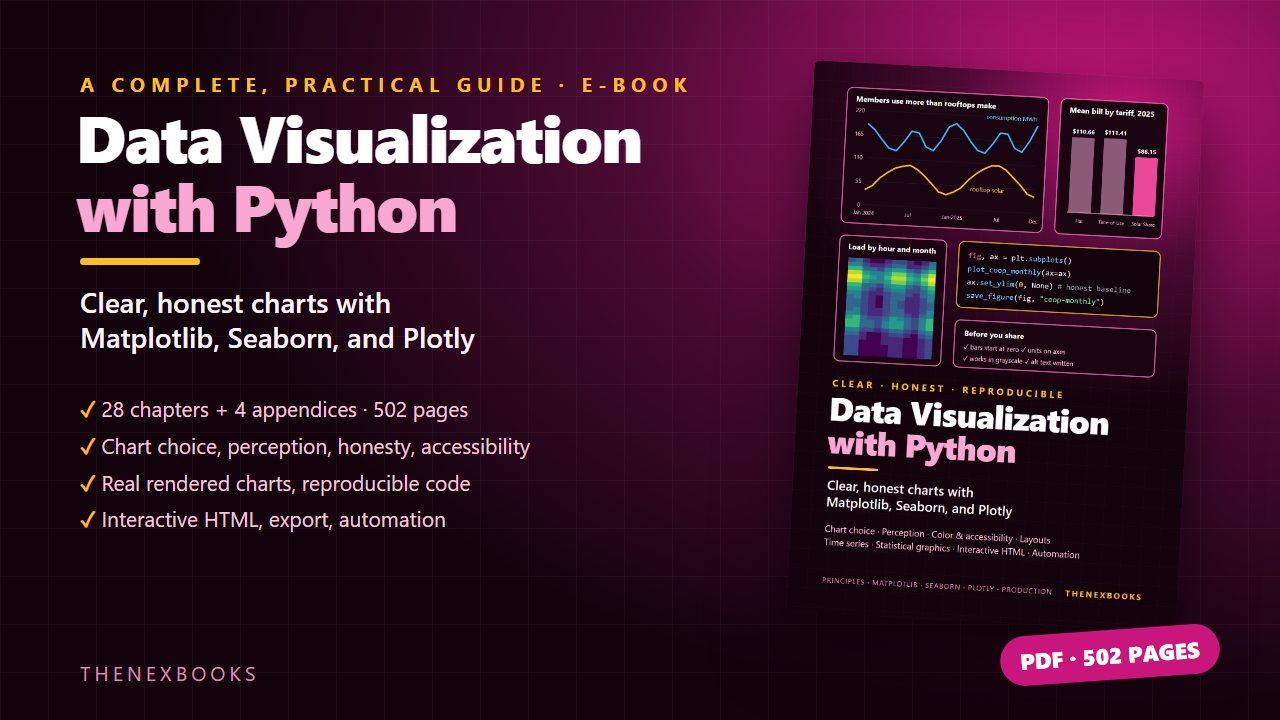
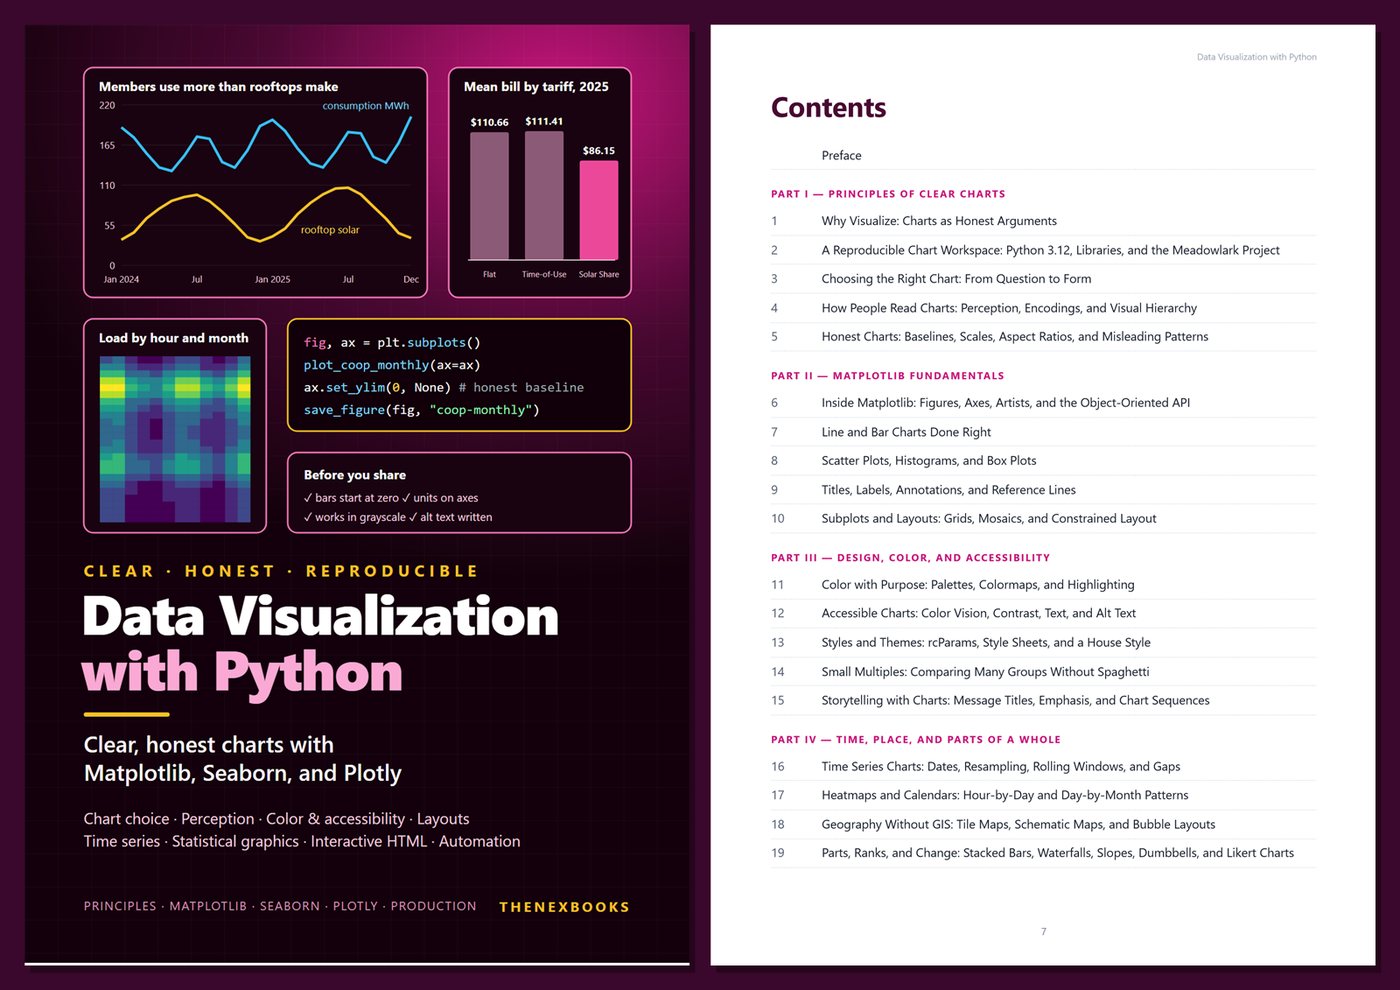
Clear, Honest Charts with Matplotlib, Seaborn, and Plotly
Read before you buy: the PDF here is a free sample — the first 20 pages of the 502-page book (payments, sales and reviews on this demo site are sample data). Get the full e-book at thenexbooks on Gumroad.
Make charts people understand and trust — and regenerate them with one command.
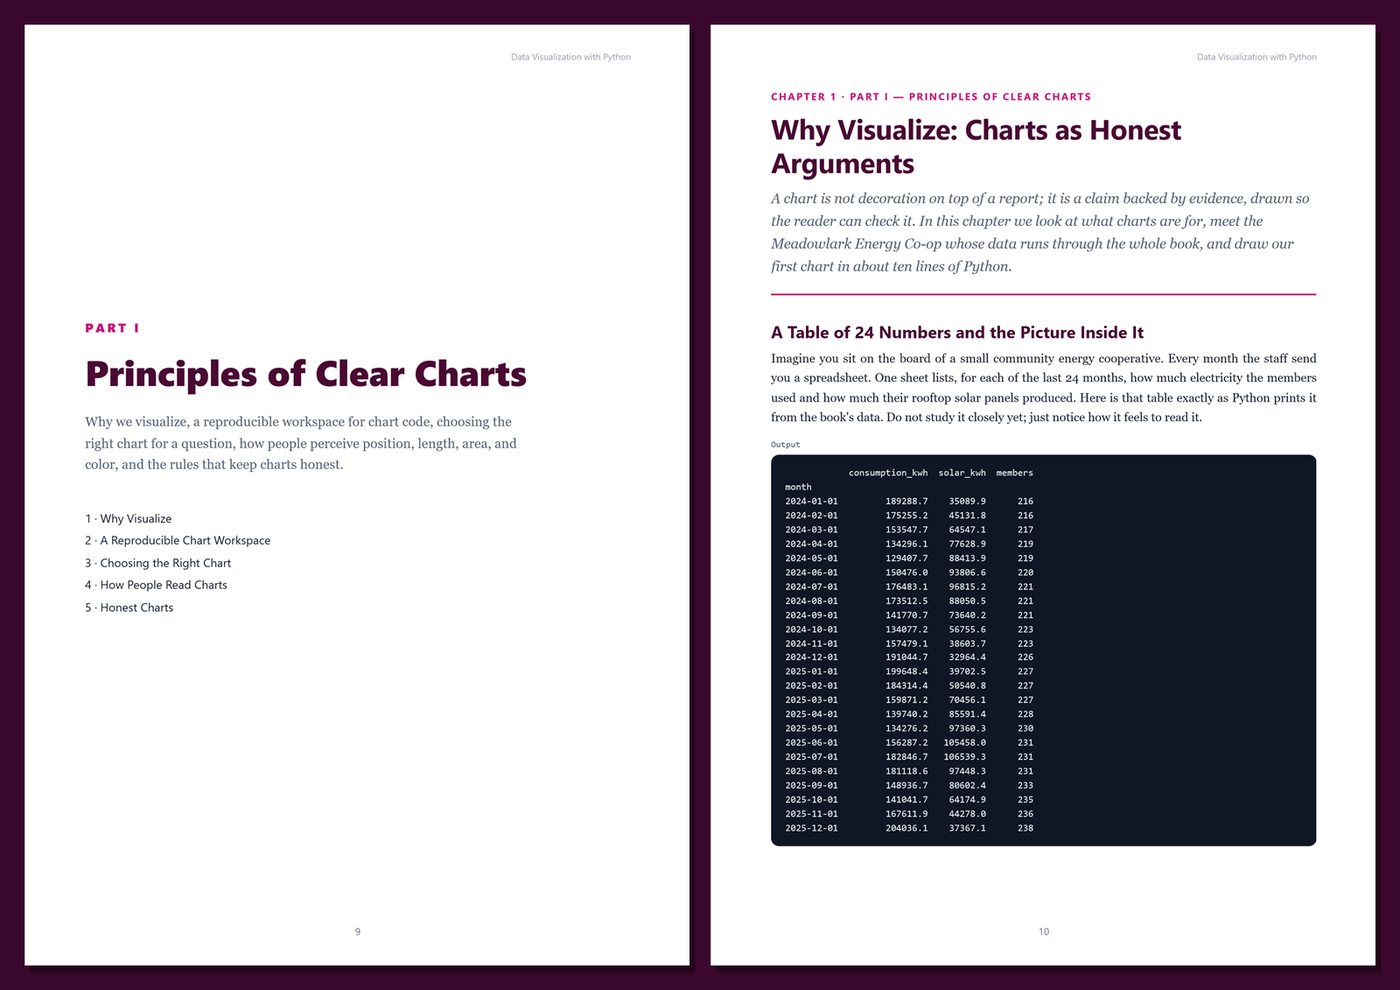
A chart is often the only part of an analysis that people actually look at. If it is cluttered, it wastes their attention; if it is misleading, it changes decisions for the wrong reasons; if it depends on color alone, it excludes part of the audience. Python gives you everything you need to do better: Matplotlib for complete control and print-quality output, seaborn for statistical graphics, and Plotly for interactive charts anyone can open in a browser.
This book teaches both the principles and the code. Every chart in it is produced by code printed in the book and run on the same dataset, so you can reproduce each figure exactly and then adapt it to your own data.
What's inside
- Why we visualize, and a reproducible workspace: Python 3.12, pinned libraries, seeded data, the Agg backend, and locale-proof number and date formats
- Choosing the right chart for comparison, ranking, change, distribution, relationship, and part-to-whole questions
- How people read charts: perception, encodings, visual hierarchy, decluttering, and direct labels
- Honest charts: baselines, scales, aspect ratios, dual axes, normalization, smoothing, and missing data
- Matplotlib in depth: figures, axes, and artists, the object-oriented API, line, bar, scatter, histogram, and box plots, annotations, reference lines, and multi-panel layouts
- Color with purpose: palettes, colormaps, diverging scales, and the gray-plus-one-highlight technique
- Accessible charts: color-vision deficiency, WCAG contrast ratios, grayscale checks, text size, and alt text
- A reusable house style with rcParams and style sheets, small multiples, and storytelling with chart sequences
- Time series with resampling, rolling windows, and gaps; hour-by-month heatmaps and calendars; tile maps and schematic maps without GIS software; stacked bars, waterfalls, slope charts, dumbbells, and Likert charts
- Statistical graphics with seaborn: distributions, KDEs, ECDFs, regression, pair plots, correlation heatmaps, error bars, and confidence intervals
- Interactive charts with Plotly Express and graph objects: hover text, range sliders, buttons, and subplots
- Dashboards-lite: a single self-contained HTML report with KPI tiles and charts, no server needed
- Exporting for print and web (PNG, SVG, PDF, DPI, fonts), byte-identical re-runs, pytest tests for chart code, and a one-command monthly chart pack with a manifest
One running example, start to finish. You chart the data of Meadowlark Energy Co-op, a fictional community energy cooperative with 240 member households, rooftop solar, three community solar arrays, three tariffs, and two full years of monthly, daily, and hourly data plus a member survey. Chapter by chapter you build a small Python package with data loaders, a house style, reusable chart functions, interactive figures, an HTML dashboard, tests, and an automated chart pipeline. The dataset is generated by a short seeded program listed in the book, so you get exactly the same numbers and charts.
Current and honest. Examples were tested with Python 3.12, Matplotlib 3.11, seaborn 0.13, Plotly 7, and pandas 3. The book contains no invented benchmarks or statistics, and every output was produced by running the code. Each chapter includes real rendered charts, complete code, Tips, Notes, Warnings, exercises, and Key Takeaways; the appendices give you a cheat sheet, full reference listings, a chart review checklist, and a glossary.
Format: PDF, 502 pages (A4), linked table of contents and bookmarks, full-color charts. English. First Edition, 2026. Published by thenexbooks. This book is independent and is not affiliated with, sponsored by, or endorsed by the Python Software Foundation or the Matplotlib, seaborn, or Plotly projects.
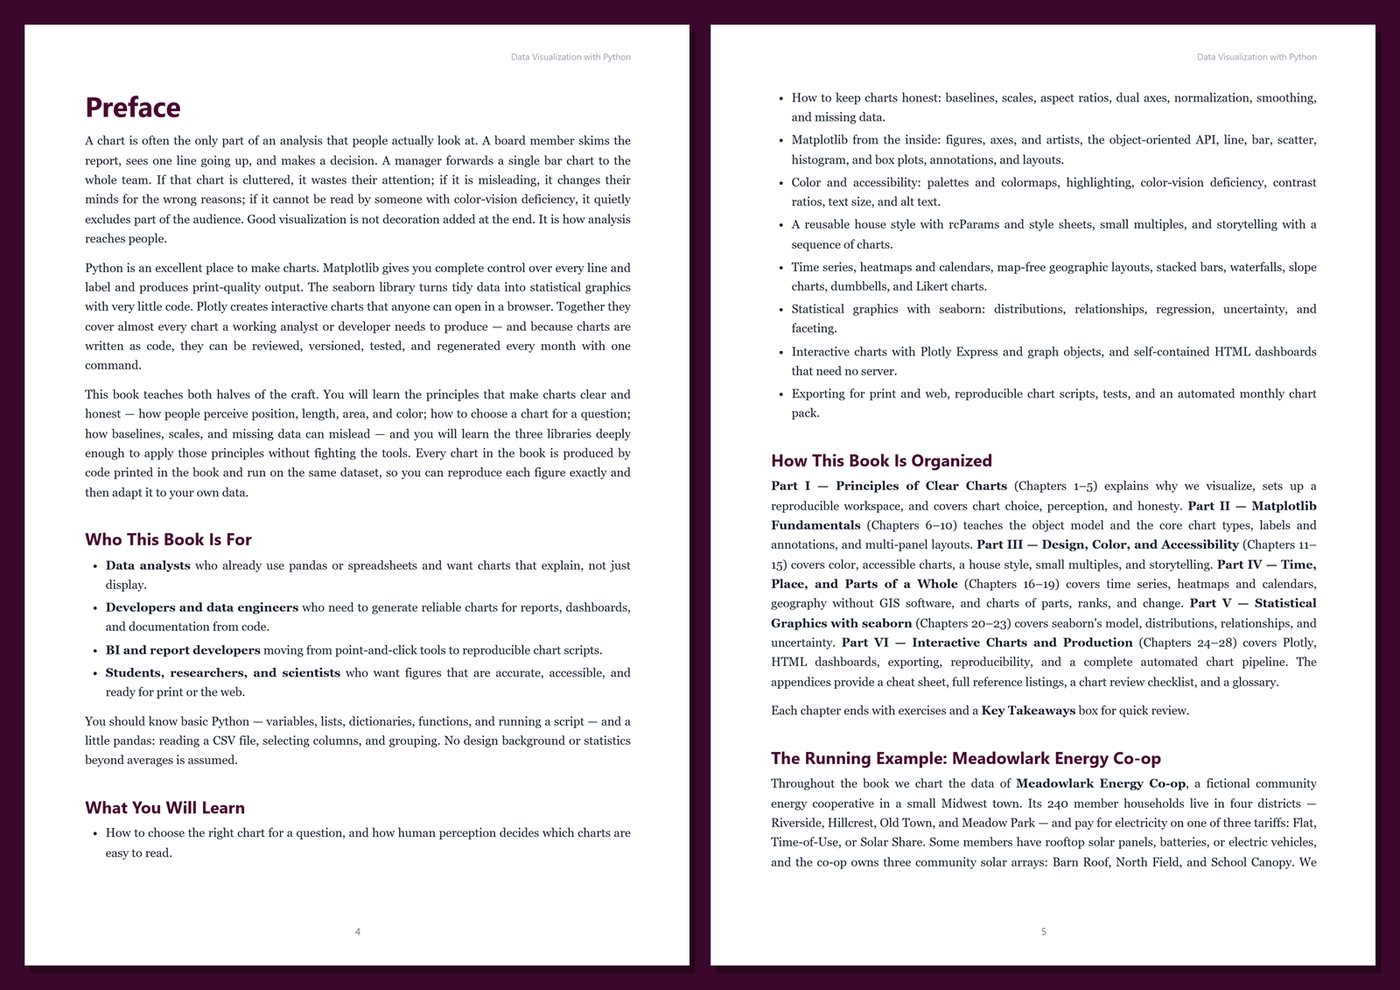
Table of Contents
Part I — Principles of Clear Charts
- Ch 1 · Why Visualize: Charts as Honest Arguments
- Ch 2 · A Reproducible Chart Workspace: Python 3.12, Libraries, and the Meadowlark Project
- Ch 3 · Choosing the Right Chart: From Question to Form
- Ch 4 · How People Read Charts: Perception, Encodings, and Visual Hierarchy
- Ch 5 · Honest Charts: Baselines, Scales, Aspect Ratios, and Misleading Patterns
Part II — Matplotlib Fundamentals
- Ch 6 · Inside Matplotlib: Figures, Axes, Artists, and the Object-Oriented API
- Ch 7 · Line and Bar Charts Done Right
- Ch 8 · Scatter Plots, Histograms, and Box Plots
- Ch 9 · Titles, Labels, Annotations, and Reference Lines
- Ch 10 · Subplots and Layouts: Grids, Mosaics, and Constrained Layout
Part III — Design, Color, and Accessibility
- Ch 11 · Color with Purpose: Palettes, Colormaps, and Highlighting
- Ch 12 · Accessible Charts: Color Vision, Contrast, Text, and Alt Text
- Ch 13 · Styles and Themes: rcParams, Style Sheets, and a House Style
- Ch 14 · Small Multiples: Comparing Many Groups Without Spaghetti
- Ch 15 · Storytelling with Charts: Message Titles, Emphasis, and Chart Sequences
Part IV — Time, Place, and Parts of a Whole
- Ch 16 · Time Series Charts: Dates, Resampling, Rolling Windows, and Gaps
- Ch 17 · Heatmaps and Calendars: Hour-by-Day and Day-by-Month Patterns
- Ch 18 · Geography Without GIS: Tile Maps, Schematic Maps, and Bubble Layouts
- Ch 19 · Parts, Ranks, and Change: Stacked Bars, Waterfalls, Slopes, Dumbbells, and Likert Charts
Part V — Statistical Graphics with seaborn
- Ch 20 · seaborn Essentials: Tidy Data, Figure-Level and Axes-Level Functions, and Themes
- Ch 21 · Distributions: Histograms, KDEs, ECDFs, Violins, and Strip Plots
- Ch 22 · Relationships: Scatter Plots, Regression Lines, Pair Plots, and Correlation Heatmaps
- Ch 23 · Categories and Uncertainty: Error Bars, Confidence Intervals, and Faceted Comparisons
Part VI — Interactive Charts and Production
- Ch 24 · Interactive Charts with Plotly Express
- Ch 25 · Plotly Graph Objects: Traces, Layouts, Hover, Subplots, and Controls
- Ch 26 · Dashboards-Lite: Self-Contained HTML Reports
- Ch 27 · Exporting for Print and Web: Formats, Sizes, Fonts, and Reproducible Scripts
- Ch 28 · Capstone: Automating the Meadowlark Monthly Chart Pack
Appendices
A · Chart and API Cheat Sheet
B · Templates and Reference Listings
C · Chart Review and Production Checklist
D · Glossary
Book details
| Detail | |
|---|---|
| Pages | 502 |
| Format | PDF (A4) |
| Language | English |
| Level | Beginner to Intermediate |
| Edition | 1st Edition (2026) |
| Download on this site | Free sample, first 20 pages (PDF) |
| Publisher | thenexbooks |
Files you get
No reviews yet. Only buyers can review.
More from thenexbooks